Alternative: use d3 helper
The previous lessons taught us how to build React axis components that can be used in any of your charts.
However, there's an alternative worth mentioning: D3 can also draw axes. Let's explore this option and see which one works best for you.
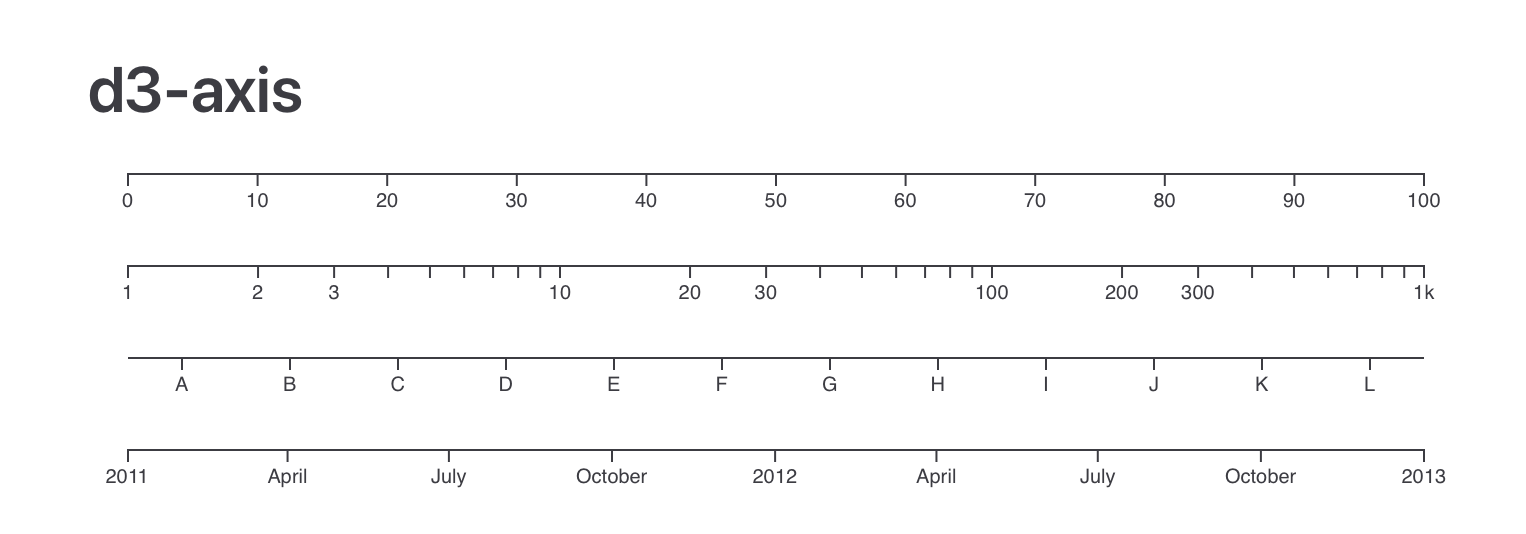
The d3 axis module
D3 has a whole module dedicated to drawing axes! It is called ... d3-axis 🙃
It performs essentially the same function as the AxisBottom and AxisLeft components we created in the previous lesson: taking a scale and rendering lines and ticks based on it on the screen.

A few axes made with d3.js and its d3-axis module.
😳 Did you say rendering?
We have a challenge: in a React environment where rendering is managed by React, how can we delegate part of the rendering process to D3?
This is possible using a react useEffect()!
Here is an example:
This axis is rendered using d3. The d3 necessary functions are called from a useEffect
How to Use D3 to Render Axes in a React App
Let's clarify the code from the example above.
⛳️ Using a ref
A ref acts as a pointer to a specific part of the DOM. We need to initialize a ref and assign it to the SVG element we want to manipulate with JavaScript later on.
To create the ref, use the following code:
const axesRef = useRef(null);Next, assign the ref to the <g> element where D3 will render the axis:
<g
  width={boundsWidth}
  height={boundsHeight}
  ref={axesRef}
  transform={...do the translate}
/>
🔧 Implementing a useEffect to modify the ref
Now, we need a useEffect that selects this ref and applies changes to it.
The useEffect hook allows us to run a function each time the component mounts and whenever specified variables are updated.
useEffect(() => {
  const svgElement = d3.select(axesRef.current);
  // Now do some stuff to this svgElement...
}, [xScale, width]); // Rerun this function when xScale or chart width changes to redraw the axis
✏️ Let's draw
Now we can use some d3.js code inside the useEffect. This will draw a bottom axis!
This code is often considered imperative, whereas React code is typically declarative.
const svgElement = d3.select(axesRef.current);

// remove potential previous axes
svgElement.selectAll("*").remove();

// d3 code to render a bottom axis:
const xAxisGenerator = d3.axisBottom(xScale);
svgElement
  .append("g")
  .attr("transform", "translate(0," + boundsHeight + ")")
  .call(xAxisGenerator);
Done! 🎉
So, React or D3.js for Axes?
Both options have their merits, each with its own set of pros and cons. Personally, I prefer the React component approach for creating axes. Here’s why:
🎨 Styling: You can customize axis elements individually, allowing for precise styling.
🔄 Lifecycle: When using D3 to create axes, they operate outside of React's lifecycle events, making it challenging to ensure they update at the right times.
♻️ Reusability: React emphasizes the creation of reusable components. Building axes with D3 each time goes against this philosophy, which simplifies development.
🛠️ Maintainability / Readability: Other developers in your organization will likely find it easier to understand the SVG markup of the AxisBottom component compared to the D3.js functions from the d3-axis module.