Margin and translation
Most chart types use a bottom and a left axis.
In these cases, we need to leave space for tick labels and axis titles. Let's look at how to implement this effectively.
SVG Area and Bounds Area
Imagine an SVG area with a width of 500px and a height of 300px.
The left and bottom axes of the chart aren't displayed right at the SVG border. Instead, there are margins on all sides: left, right, bottom, and top.
The area within these margins is known as the bounds. That's where the chart content is positioned, with the chart axes on the border.
In our code, we'll refer to the width and height of this bounds area as boundsWidth and boundsHeight.
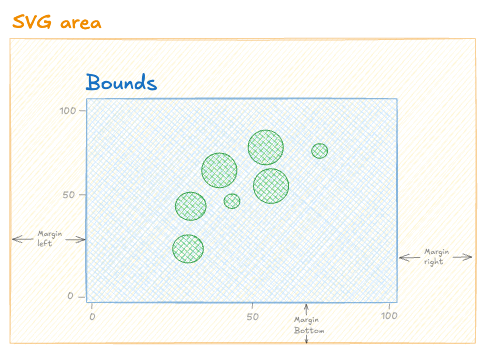
Anatomy of the chart areas: some margins are set all around the SVG area. The area inside is called the Bounds.
Implementation
A chart component often starts by defining its margins. An object with 4 properties is ideal for that:
const MARGIN = {
  top: 10,
  right: 30,
  bottom: 50,
  left: 30
}
Since the chart component has defined width and height, we can easily determine the dimensions of the bounds area, referred to as boundsWidth and boundsHeight:
const boundsWidth = width - MARGIN.right - MARGIN.left;
const boundsHeight = height - MARGIN.top - MARGIN.bottom;
Oh no! 😱
It seems like you haven't enrolled in the course yet!
Join many other students today and learn how to create bespoke, interactive graphs with d3.js and React!
Enrollment is currently closed. Join the waitlist to be notified when doors reopen:
Or Login