Introduction to svg
At its core, a graph is just a bunch of shapes such as circles, rectangles, and lines displayed on a screen. Using standard HTML elements to draw these shapes would be cumbersome and limiting.
Fortunately, there's a more efficient solution: SVG. SVG is a versatile and widely-used technology that allows us to draw shapes in the browser with precision and ease.
🤔 What is SVG
Scalable Vector Graphics (SVG) is an XML-based format for vector graphics. Unlike raster graphics which are made up of pixels, SVG uses vector data (points, lines, and curves) to create images. This means SVG images are resolution-independent and can scale up or down without losing quality.
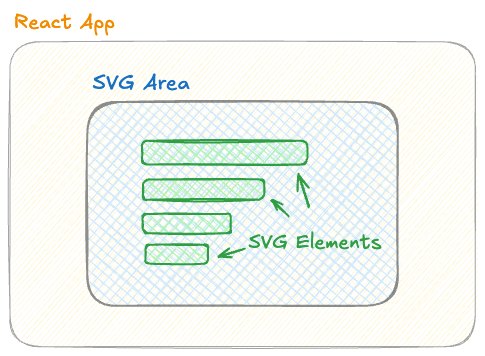
Anatomy of a React app with a graph built in a svg area.
👶 Simplest example
Here is a very simple React app that uses SVG to render a circle:
A React component called SvgCircle is defined in a file called SvgCircle.tsx.
It renders an SVG area thanks to a <svg> HTML element with a width and height.
In this SVG area, a <circle> is drawn. cx and cy set the position of the circle, and r sets its radius.
Awesome! With just a few more circles like this, we'll have a complete scatterplot!
Oh no! 😱
This lesson isn’t available just yet.
Take a look at the status badges next to each lesson in the sidebar to see when it’s coming out.
Thanks for your patience! 🙏