Animation

Animation is both the most challenging and the most exciting part of an interactive chart. Animation is like salt: use the right amount of it and your creation is a delight. Too much of it and it spoils the dish 🤌.
There are many ways to animate the transition between 2 chart states. Here I suggest to use react-spring in combination with react andd3.js.
Work in Progress
This section is a work in progress. 🚧
For now, it just lists all the charts using react-spring in the gallery.
But I plan to write some complete tutorials on this passionating and complicated topic. You can subscribe to the project to know when it's ready!
Bubble plot data set transition
How to smoothly animate the transition between dataset
Violin to Boxplot transition
Using shape morphism to smoothly transition from a boxplot to a violin and reverse
Bucket size effect
Interactive example showing the bucket size effect on a violin chart
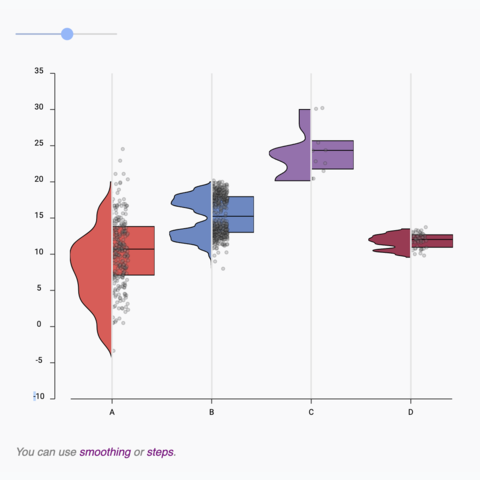
Boxplot to Violin plot
Interactive example showing the difference between a boxplot and a violin
Histogram dataset transition
How to animate the transition between datasets
Barplot dataset transition
How to smoothly animate the transition between dataset
Line chart with dataset transition
How to smoothly animate the transition between 2 dataset on a line chart
Offset and Smoothing transition
An interactive streamgraph example showing how to animate transition between the chart stacking features.
General Knowledge


Contact
👋 Hey, I'm Yan and I'm currently working on this project!
Feedback is welcome ❤️. You can fill an issue on Github, drop me a message on LinkedIn, or even send me an email pasting yan.holtz.data with gmail.com. You can also subscribe to the newsletter to know when I publish more content!
