Strategy 4: react internal state
We've already explored three different strategies for adding hover effects to a chart! 😳 Each relies heavily on CSS, which is ideal as it requires minimal redrawing.
However, sometimes a more traditional React approach is needed, using a central state to trigger redraws when the state updates. Let’s explore why. ⬇️
⚙️ Why and How
Imagine you have multiple UI components. Say, a barplot and a pie chart, both displaying numbers for the same groups.
When you hover over Group B on the barplot, you also want group B to be highlighted on the pie chart. This setup is common in dashboards.
The CSS-focused strategies we've used before won’t work here. Instead, we need a parent component that wraps both charts and manages a shared state. When one chart is hovered, it updates the shared state, which in turn updates both charts.

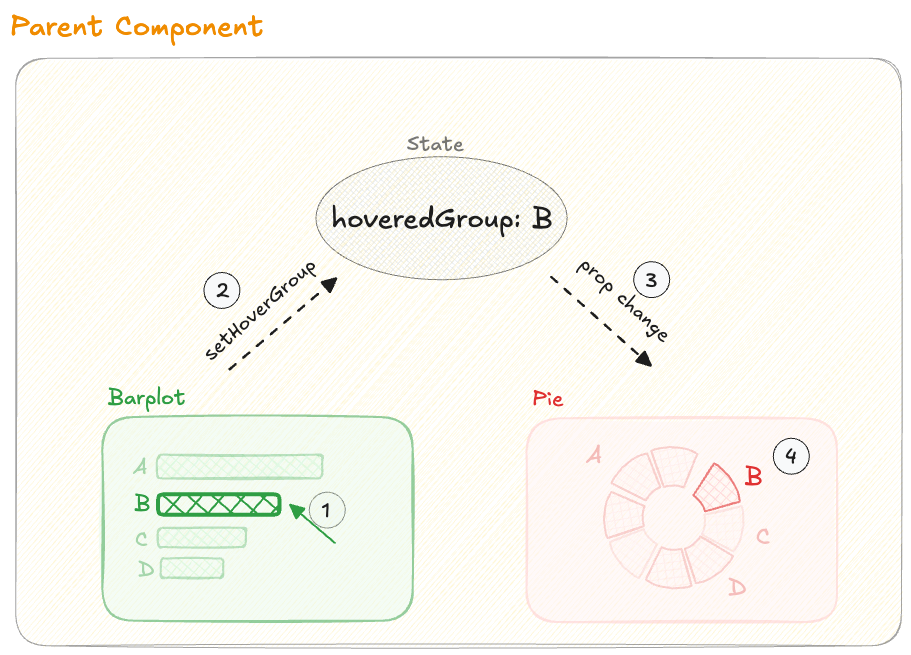
Anatomy of a state update, connecting 2 charts together.
Here’s a step-by-step breakdown:
1️⃣ The mouse hovers over group B on the bar plot, triggering a function thanks to onMouseEnter
2️⃣ This function calls setHoverGroup, updating the global state in the parent component.
3️⃣ hoveredGroup, the global state, is passed to the pie chart as a prop.
4️⃣ When hoveredGroup updates, the pie chart re-renders, highlighting the group B slice.
Let's code!
1️⃣ Internal state
First, we need an internal state (called hoveredGroup) that stores which group is hovered hover. It can also be null if there is nothing hovered!
This is possible thanks to the useState hook:
const [hoveredGroup, setHoveredGroup] = useState<string | null>(null);2️⃣ Updating the state
Now, this state needs to be updated when a user hovers over a bar in the Barplot component.
To do so, the setHoveredGroup() function can be passed as a prop to the Barplot component.
<Barplot width={300} height={300} setHoveredGroup={setHoveredGroup}>Then, the onMouseOver attribute of each rectangle can call this setter function!
<svg>
  {data.map(d => {
    return(
      <rect
        x={}
        y={}
        onMouseOver={() => setHoveredGroup(d.group)} // update the state
        onMouseLeave={() => setHoveredGroup(null)} // and to set it back to null
</svg>
That's it, the state is updated!
3️⃣ Update the pie chart
hoveredGroup is now updated. We just have to pass it to the pie chart component!
<Pie width={300} height={300} hoveredGroup={hoveredGroup}>This will trigger a rerender of the Pie component, since a prop just changed.
4️⃣ Highlight a slice
Now, we can use the value of hoveredGroup in the rendering logic to change the style of the slice that must be highlighted.
<path
    fill = {d.group === hoveredGroup ? "blue" : "red"}
/>
Example
Here’s a preview of this strategy in action. Hover over one graph, and watch the corresponding section in the other graph highlight as well:
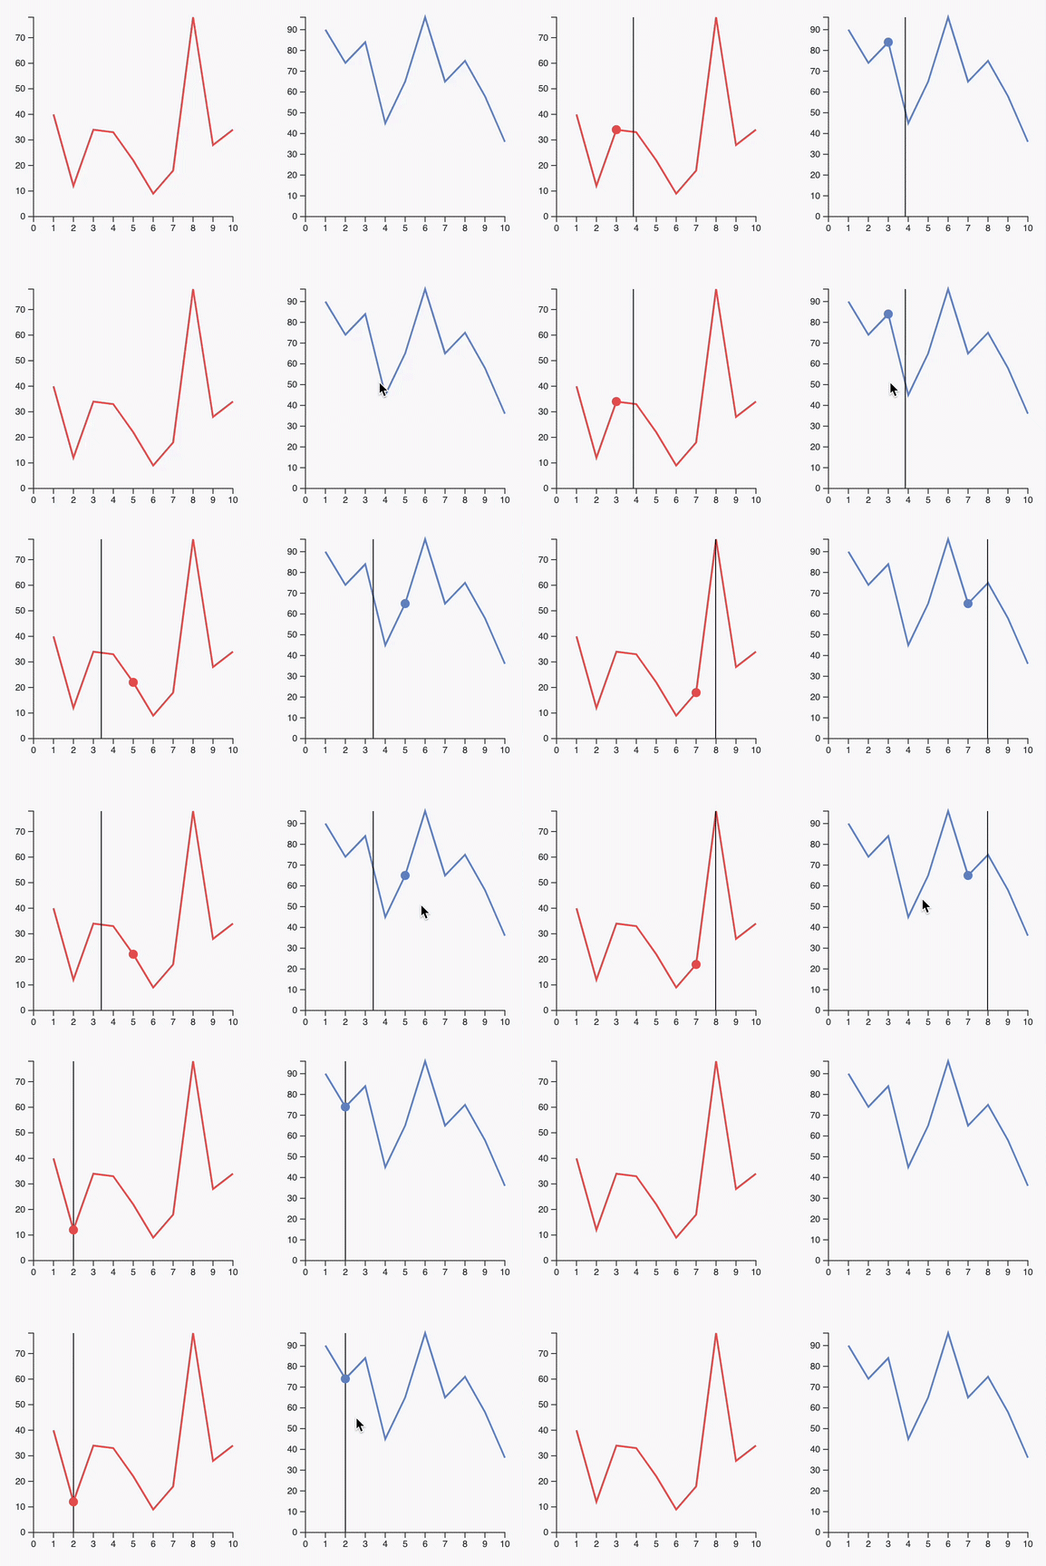
Two graphs inter-connected thanks to a hover effect
Pros & Cons
- Enables synchronization across multiple UI components, allowing hover effects, tooltips, and text highlights to update together. Highly versatile.
- Provides flexibility for hover effects by using JavaScript animations, for instance, with
react-spring.
- Performance 🚨🚨🚨: Redrawing all elements on each hover event can significantly impact performance, especially with many elements, such as thousands of circles.
More examples
The examples below all use this strategy to implement their hover effect.

Synchronized cursors
Add a cursor synchronized on all your charts

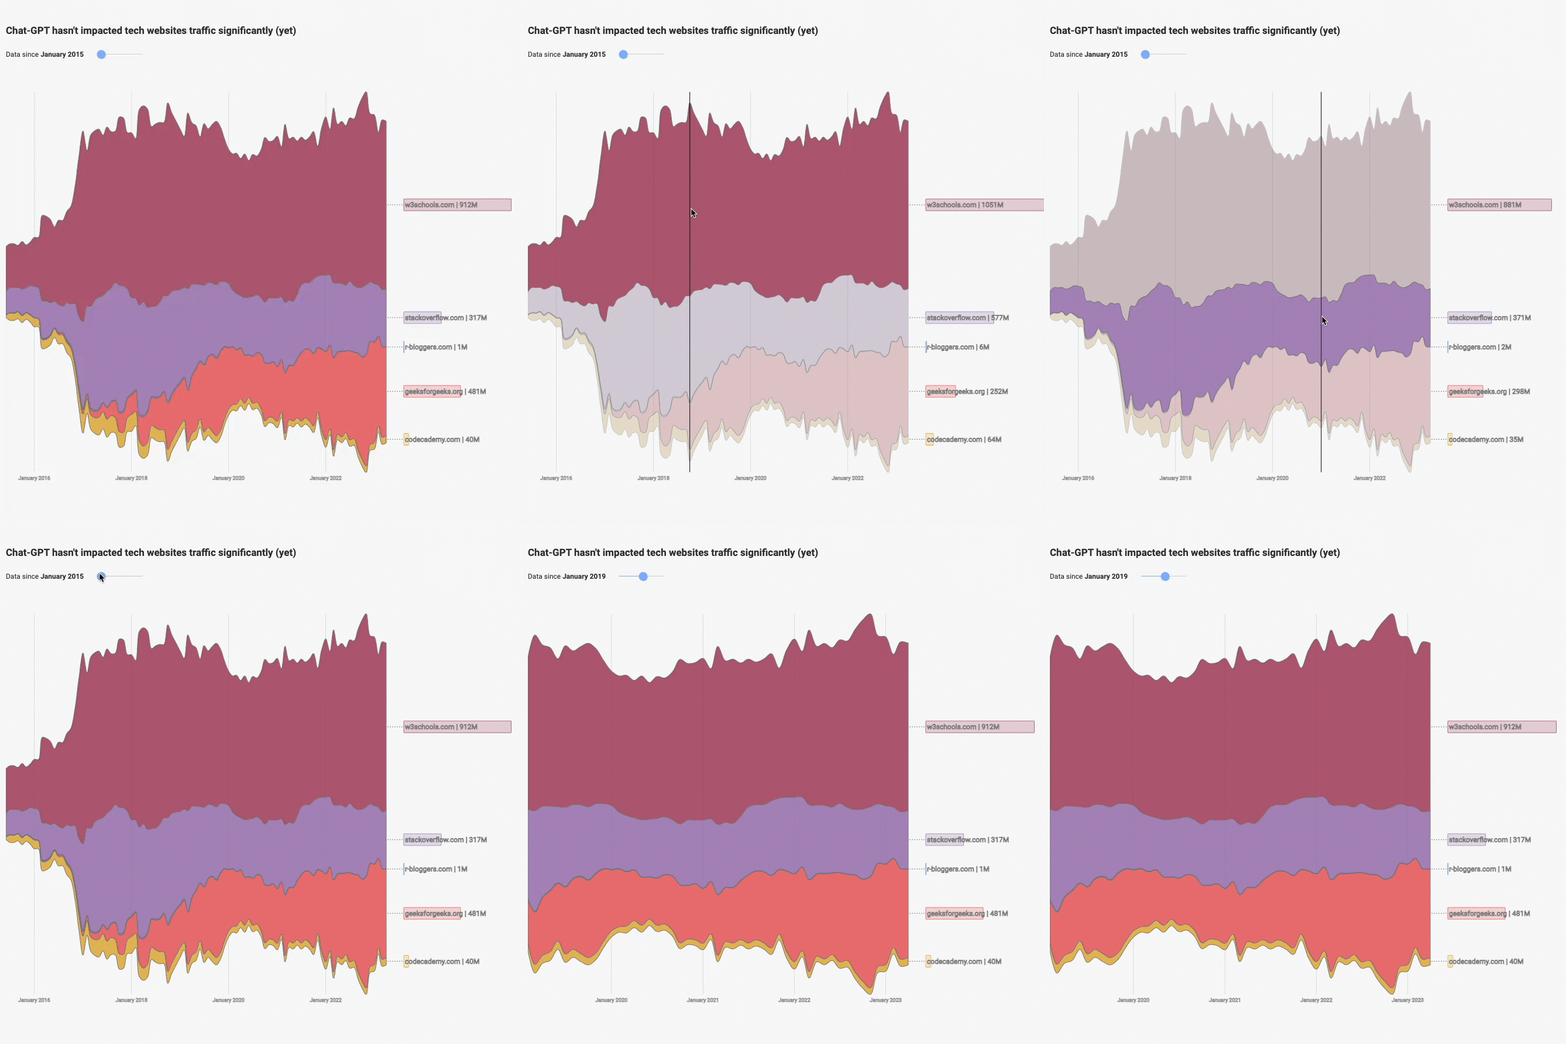
Streamgraph application
Streamgraph with a slider to zoom on a time stamp and with interactive inline legends
Exercise
Open a new sandbox, and build the barplot + pie chart example above from scratch!
Remember, this strategy can have performance drawbacks! We'll cover a workaround using Canvas later in this course.