What is d3
D3.js is a powerful JavaScript library that offers a wide range of functions for creating dynamic graphs and visualizations.
Its popularity is immense; you’ll find it hard to encounter a web-based graph that doesn’t leverage D3 in some capacity. Let’s explore why it’s become such an essential tool.
🌳 Try to make a treemap
Do you know what a treemap is?
It is this kind of graph, where rectangles are used to represent hierarchical data, with size proportional to a value:
A basic treemap made with React and D3.js
Drawing rectangles with React and some divs is simple. But how do you calculate the coordinates to ensure each rectangle's area matches its corresponding value? 🙈
That's exactly what the treemap() function in d3.js does for you.
And that's why we need d3!
Note: the React Graph Gallery has a whole section on treemaps! But do not try to understand the code for now!
❌ Not a Charting library
It's important to understand that D3 is not a charting library.
A charting library would offer a ready-made Scatterplot component where you pass some properties, and it renders the chart for you.
D3 doesn’t do that. It provides utility functions to help you create your scatterplot, but it won’t build it for you.

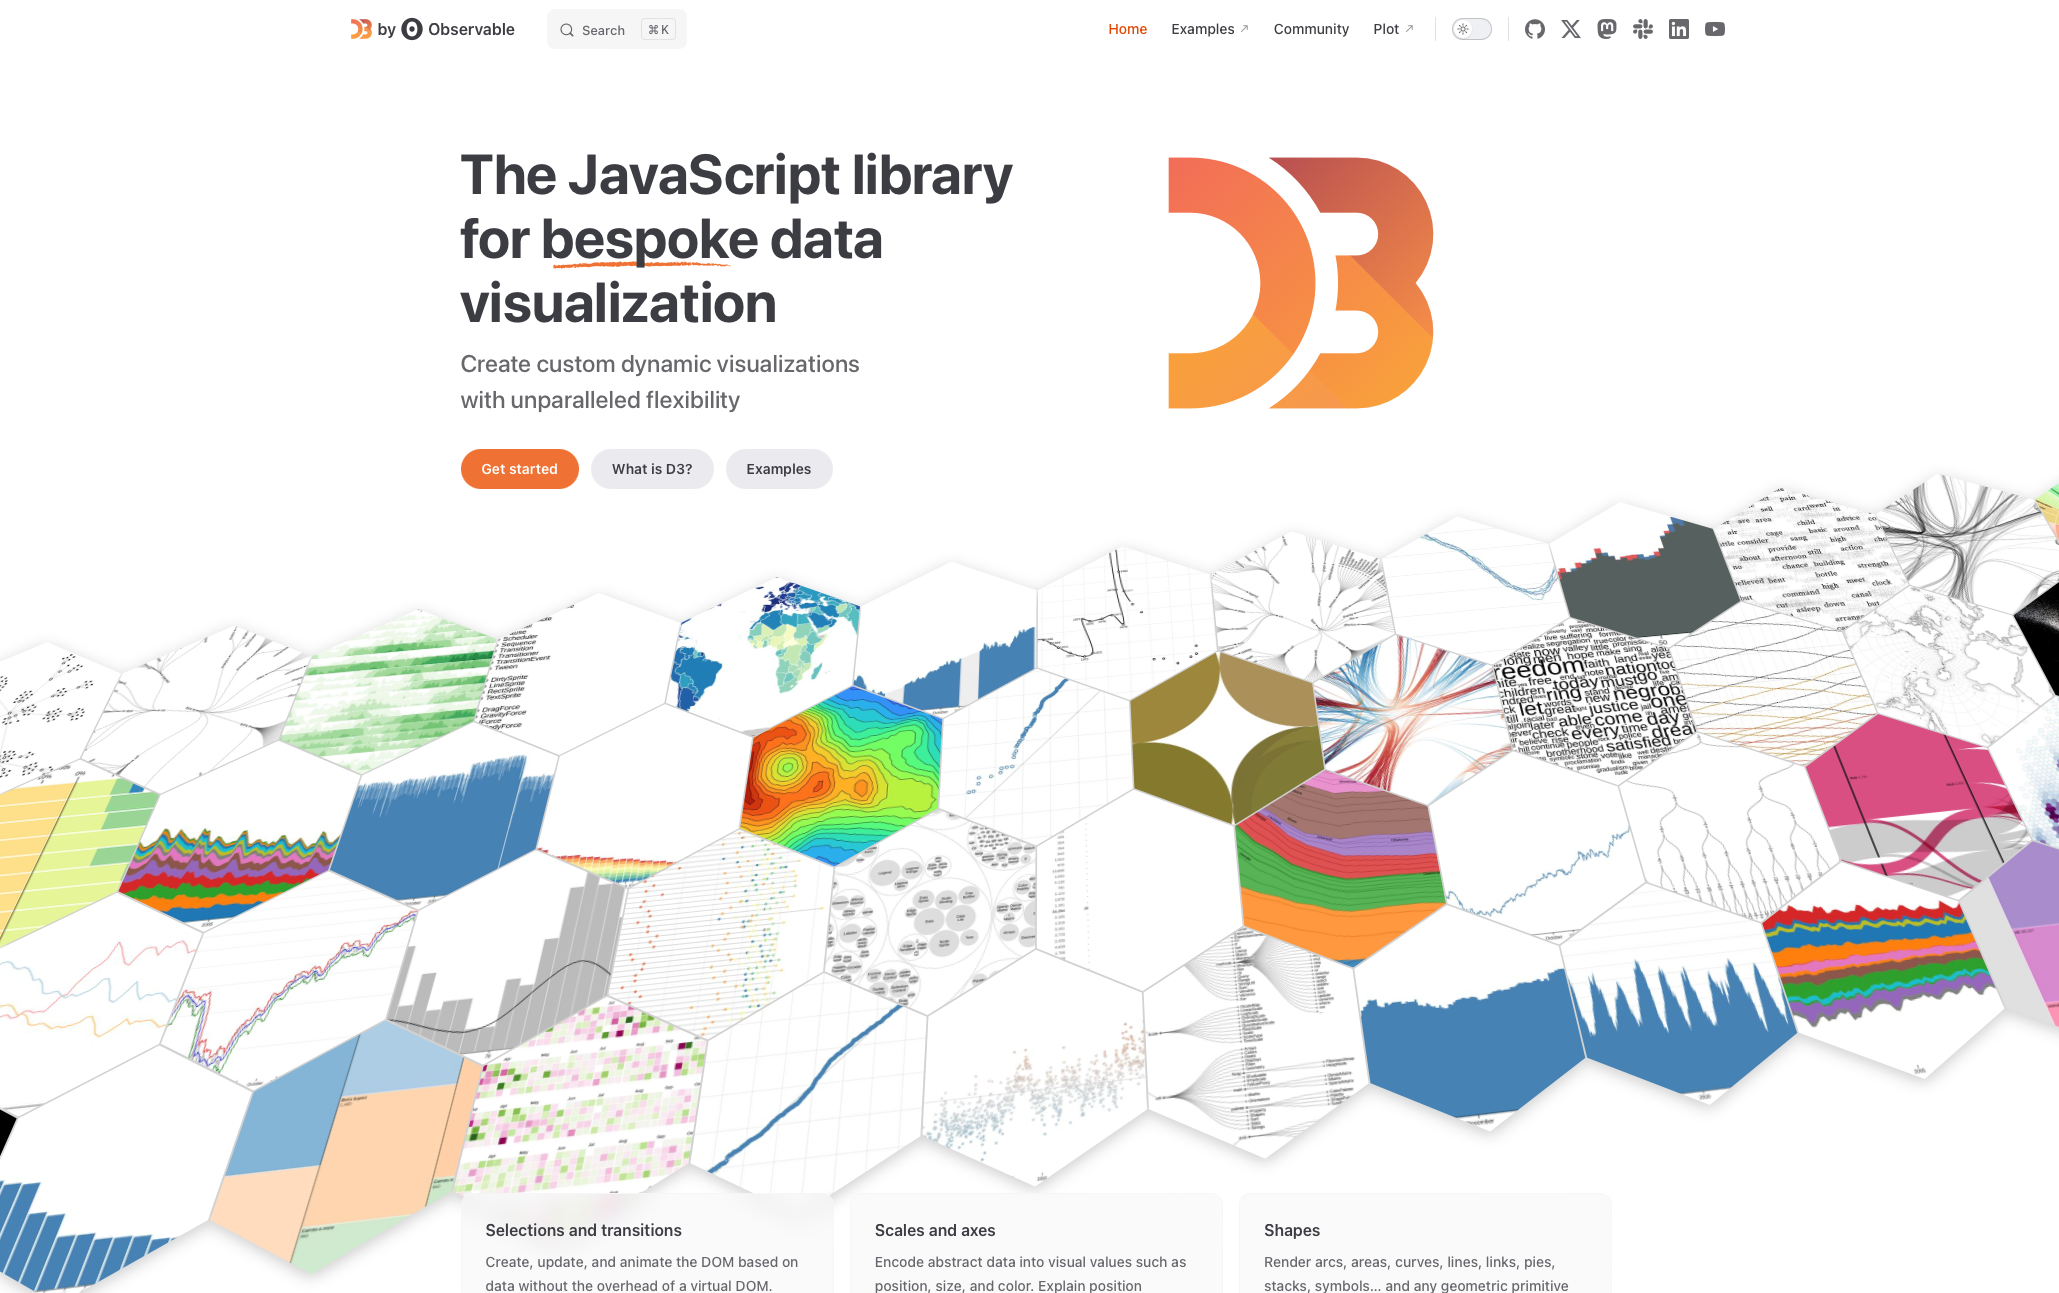
D3.js website screenshot.
That's why d3 is ideal for "bespoke" dataviz. It requires more effort but gives you complete control for any customization.
🗡️ Only a fraction
D3.js offers a wide range of functions, which can be grouped into two main categories:
📐 Math functions
These include functions like treemap() mentioned earlier. They return numbers, positions, colors, or text, but don’t interact with the DOM.
✍️ Rendering functions
Functions that modify the DOM, like append, which can add elements (e.g., a circle) to an SVG.
Here’s the good news: in a React environment, we only need D3's math functions, since all the rendering will be handled by React and its JSX!