Chart libraries: don't
99% of developers have the same instinct when it comes to adding a chart to a web application: reach for a JavaScript library that offers a pre-made chart component.
While that's a great starting point, it often leads to unexpected and painful complications. Let's explore why, and why D3 might be the cure.
⏱️ In a hurry
Here is a typical story from your life as a developer.
You're working on an impressive web page and you've been asked to add a barplot. The specs are nothing crazy! You'll need a few rectangles, one axis, some labels, and a title.
The good news?
There are plenty of JavaScript dataviz libraries that can handle this perfectly. They all offer a Barplot component you can call easily with a few props to fit your style. 🎉
Here is a list of the most popular options:
A charting library is a high-level tool that provides ready-made chart components (bar chart, line chart, pie chart...). You pass your data and a few options, and the library draws the chart for you.
Spoiler: D3.js is NOT a charting library.
Let's try with Nivo (I used it for a client recently).
All you have to do is npm install the lib, import its ResponsiveBar component, and use it with 3 required props: data, keys, and indexBy.
// Import lib
import { ResponsiveBar } from '@nivo/bar';

// Make a barchart
<ResponsiveBar data={data} keys={['value']} indexBy="country"/>
That's just 3 lines of code, and it gives a fantastic barplot! Your supervisor is probably thrilled to see how quick it was to build such a complex UI element.
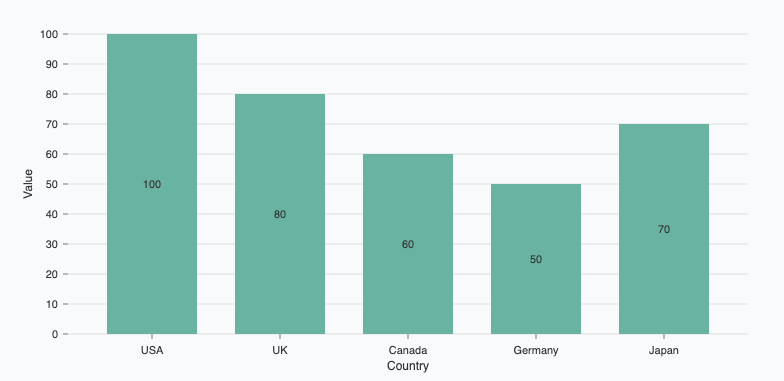
A basic barplot made using the Nivo library in 3 minutes.
Oh no! 😱
It seems like you haven't enrolled in the course yet!
Join many other students today and learn how to create bespoke, interactive graphs with d3.js and React!
Enrollment is currently closed. Join the waitlist to be notified when doors reopen:
Or Login