Barplot, Streamgraph and hover effect
This article is an addition to the barplot and Streamgraph sections of the gallery.
It dives into hover effects, and implements 2 different effects. If you want to learn about hover effects in general, there is a hover effect dedicated section in the gallery.
Now let's see how to highlight bars!
Plot and code
Here is a code sandbox in case you want to jump straight into the code.
Note that the gallery provides an in-depth description of the process leading to a barplot. This page will just highlight the differences for the vertical version!
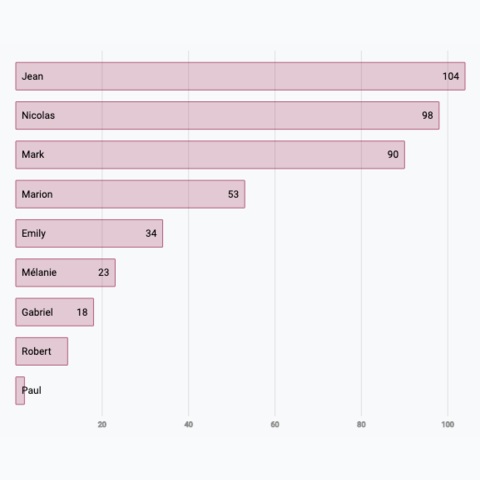
Basic vertical barplot made with React and D3.js
How it works
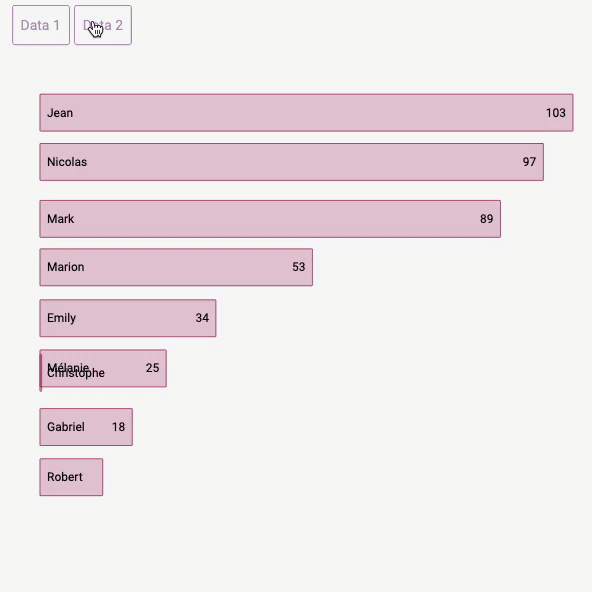
There are several ways to implement a hover effect.
In this example, two charts are linked together using a shared state. This shared state keeps track of which group is currently highlighted. Both charts can update it via an updateHighlightedGroup function, and they also read from it through the highlightedGroup prop.
This approach is explained in detail in the hover effect section of the gallery!
Variation
Check those other barplot and stacked barplot that can interest you:
Basic barplot
Most basic barplot built with React and d3
Barplot dataset transition
How to smoothly animate the transition between dataset
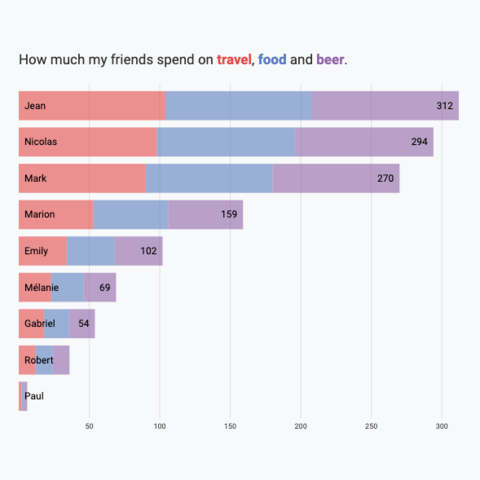
Horizontal Stacked Barplot
Represent group and subgroup values by stacking the data
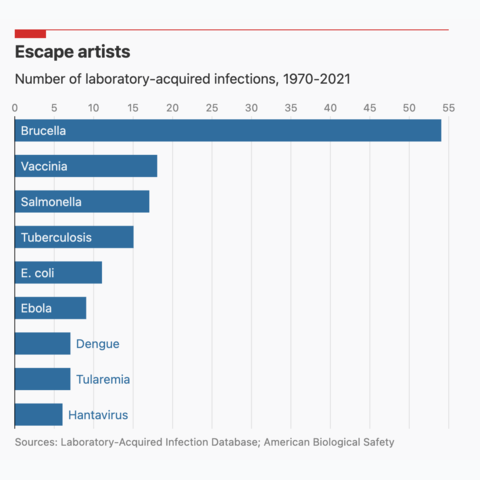
The Economist Barplot repro
Reproduction of a barplot made by The Economist
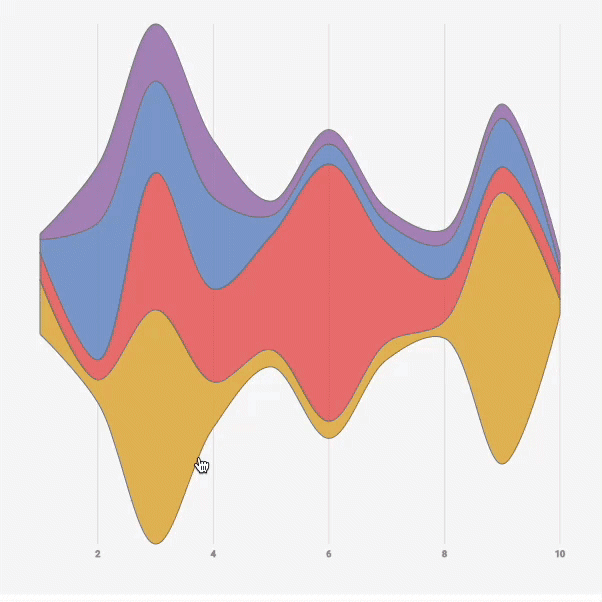
Streamgraph with hover effect
How to add a hover effect on a streamgraph to highlight a group
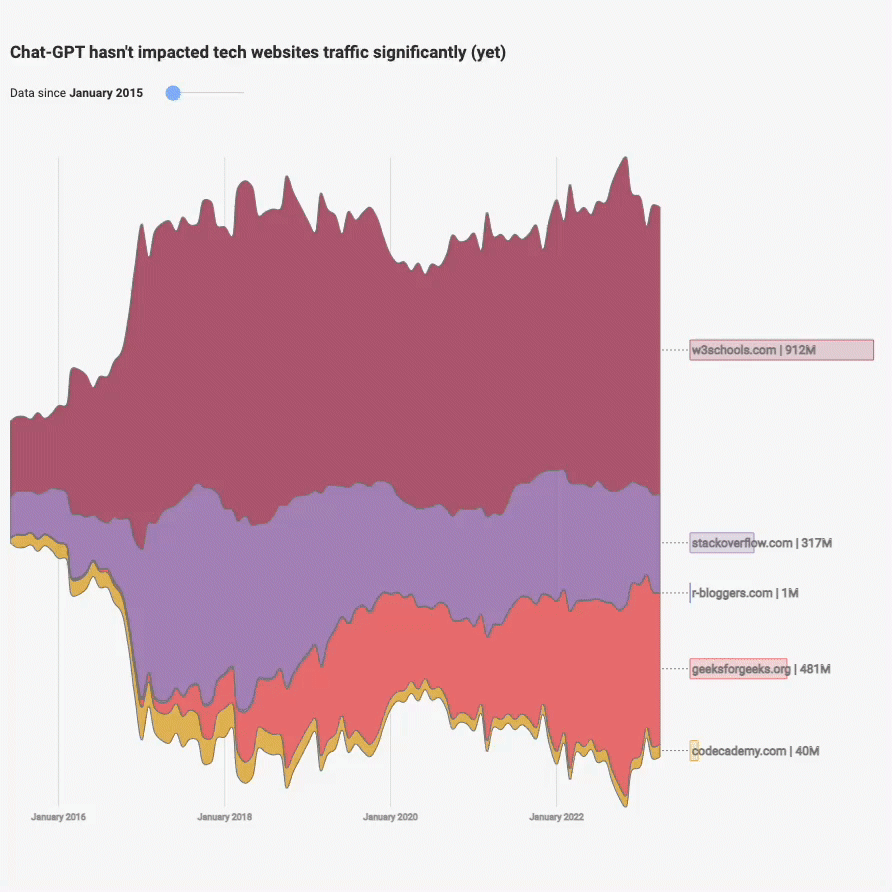
Streamgraph application
Streamgraph with a slider to zoom on a time stamp and with interactive inline legends


Contact
👋 Hey, I'm Yan and I'm currently working on this project!
Feedback is welcome ❤️. You can fill an issue on Github, drop me a message on Twitter, or even send me an email pasting yan.holtz.data with gmail.com. You can also subscribe to the newsletter to know when I publish more content!