Circular Packing
A circular packing chart displays a hierarchical dataset as a set of nested circles, each circle representing a node of the data structure. Size is usually proportional to a numeric variable.
This page is a tutorial teaching how to create a circle pack chart with d3.js and React. It starts with a very basic version, adds some levels of nesting and finishes with usual customization like animating the transition between datasets.
The Data
The dataset describes a hierarchy using a recursive structure. It is similar to a dendrogram or to a treemap.
Each item in this structure is called a node, the lowest nodes of the hierarchy being called leaves. The dataset is an object that has at least 3 properties: name, value and children. Children is an array of nodes that have this structure too.
Here is a minimal example of the data structure:
const data = {
  type: 'node',
  name: "boss",
  value: 2300,
  children: [
    {type: 'leaf', name:"Mark", value: 90},
    {type: 'leaf', name:"Robert", value: 12},
    {type: 'leaf', name:"Emily", value: 34},
    ...
}
Dealing with a hierarchical dataset
The circle packing chart belongs to the family of charts being based on a hierarchical dataset.
Members of this family always follow the same process: the dataset is passed to the hierarchy() function of d3.js that creates a handy format for us.
Building a dendrogram will then be possible thanks to the cluster()function. Building a treemap is then possible with the treemap()function. Building a circle pack will be possible with the pack()function.
The hierarchy() function of d3.js is a key part of the process. I extensively described how it works in the dendrogram section and strongly advise to take a look at it before continuing.
hierarchy()Component skeleton
The goal here is to create a CircularPacking component that will be stored in a CircularPacking.tsx file. This component requires 3 props to render: a width, a height, and some data.
The shape of the data is described above. The width and height will be used to render an svg element in the DOM, in which we will insert the histogram.
To put it in a nutshell, that's the skeleton of our CircularPacking component:
import * as d3 from "d3"; // we will need d3.js

type CircularPackingProps = {
  width: number;
  height: number;
  data: number[];
};

export const CircularPacking = ({ width, height, data }: CircularPackingProps) => {

  // read the data
  // compute the hierarchy format with hierarchy()
  // compute circle position with pack()
  // build the circles

  return (
    <div>
      <svg width={width} height={height}>
        // render all the <circle>
      </svg>
    </div>
  );
};
It's fundamental to understand that with this code organization, d3.js will be used to prepare the SVG circle, but it's React that will render them in the return() statement. We won't use d3 methods like append that you can find in usual d3.js examples.
Circle packing with 1️⃣ level of nesting
Here is a summary of the process used to build a circle pack with 1 level of nesting:
→ Compute circle position and radius
Pass the dataset to the hierarchy() function of d3. It builds a specific kind of object from it. This object can be consumed by the pack() function of d3 that computes the position and radius of each circle.
// build the hierarchy object
const hierarchy = d3
  .hierarchy(data)
  .sum((d) => d.value)

// compute the 2d coordinates of nodes
const packGenerator = d3.pack()
  .size([width, height])
  .padding(4); // space between circles
const root = packGenerator(hierarchy);
For each node of the hierarchy, 3 new properties are now available: x, y and r that provide the coordinates and radius of each circle respectively.
→ Render the circles with react
The root object computed above has a .descendants() method that lists all the nodes in an array.
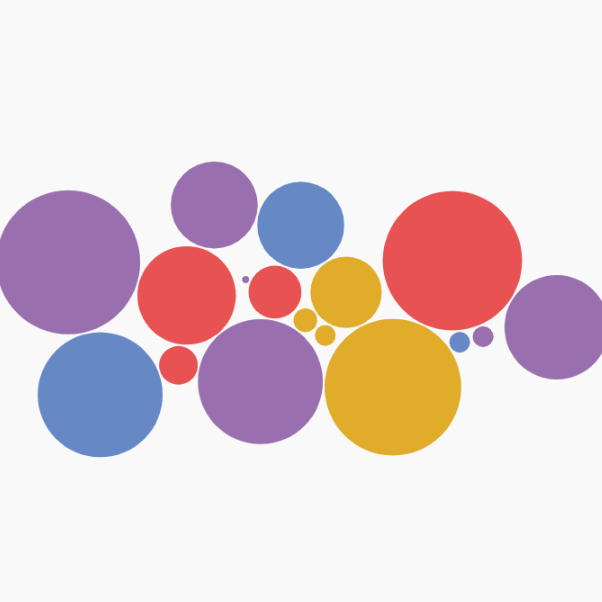
It is straightforward to map along those nodes. For each item, we can render acircle element following with a text element to get the following chart.
Most basic circle packing chart built with react and d3.js. One level of nesting.
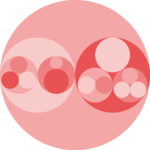
Circle packing with 2️⃣ levels of nesting
The process to follow is pretty similar to add a second level of nesting.
But this time 2 loops are required. The first one will be used to draw the first level of nesting. The second to draw the leaves.
Circle packing chart built with react and d3.js. Two levels of nesting.
Dataset transition
The following examples explains how to transition between 2 datasets. Each circle smoothly goes to its new position with its new radius.
This is possible thanks to the react-spring library that does the interpolation and animation. When a new dataset is passed to the component, the hierarchy() and pack() functions are triggered to compute the new position and radius of each node. But instead of passing this information to an usual circle or textsvg element, it is passed to an animated component that looks like this:
const AnimatedCircle = ({cx,cy,r,...props}) => {
  const animatedProps = useSpring({
    cx,
    cy,
    r,
  });
  return (
    <animated.circle
      {...props}
      r={animatedProps.r}
      cx={animatedProps.cx}
      cy={animatedProps.cy}
    />
  );
}
This component uses the useSpring hook of react spring to interpolate the cx, cy and r properties. Those values are passed to a special svg element (animated.circle) that does the animation.
Animating the transition between 2 similar dataset with react and d3.js (for rendering) and react spring (for animation).
Animation in dataviz using React is a big topic. It's impossible to go in depth here! I will publish a dedicated blog post on the topic soon. Please subscribe to the newsletter if you want to be notified.
Subscribe
ToDoZoom on next level of hierarchy
ToDoWrite label along circle with curve
ToDoBetter dataset transition where circle keep position
Variations
Once you've understood how to build a basic circular packing with d3 and react, it opens an infinite world of customization. Here are a few examples using the same concepts.
Click on the overview below to get details and code.
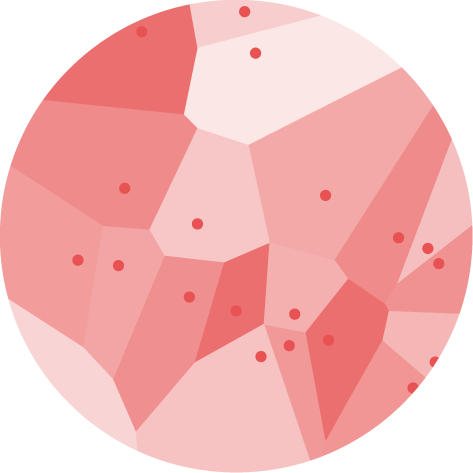
Circle Pack with d3-force
Another approach to build a circle packing chart using physical forces to compute node positions.
Part Of A Whole


Contact
👋 Hey, I'm Yan and I'm currently working on this project!
Feedback is welcome ❤️. You can fill an issue on Github, drop me a message on Twitter, or even send me an email pasting yan.holtz.data with gmail.com. You can also subscribe to the newsletter to know when I publish more content!