Voronoi Diagram
A voronoi diagram is a partition of a plane into regions called voronoi cells. A voronoi cell consists of every point in the plane whose distance to its linked data point is less than or equal to its distance to any other data point.
This page is a step-by-step guide on how to build your own voronoi diagram for the web, using React and D3.js.
It starts by describing how the data should be organized and explains how to run and plot a Delaunay triangulation. Based on this, it explains how to build the voronoi diagram. Finally it shows how this can be used for real life application like for a scatterplot or to build a voronoi treemap.
The Data
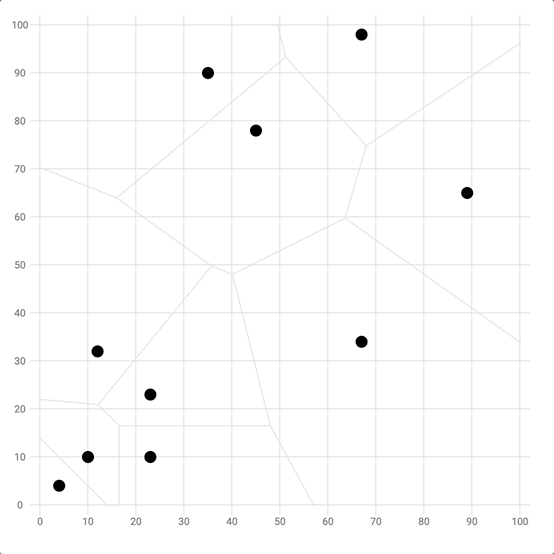
Everything starts with a set of two-dimensional points. Their coordinates are available with x representing the position on the horizontal axis and y being for the vertical axis.
As a result, the dataset is pretty simple: an array of objects that looks like this:
export const data = [
  { x: 10, y: 10 },
  { x: 4, y: 4 },
  { x: 35, y: 90 },
  { x: 67, y: 34 },
  ...
];
Note: this is the same dataset as the one used for a scatterplot.
A set of two-dimensional points
Let's start by plotting those data points on a two-dimensional points. This is basically a scatterplot except that we're not drawing the axes.
If you're not familiar with the basic steps used in the following sandbox, please take a look at the scatterplot section of the gallery that goes in deep on what's going on here.
Scatterplot sectionYou need a good understanding about d3 scales, how to loop through a data array to create svg elements and how to make the component renders them.
A voronoi diagram starts with a set of 2d coordinate points plotted on a plane.
Delaunay triangulation
The first required step to build a voronoi diagram is to run a Delaunay triangulation.
You don't necessarily need to understand what a Delaunay triangulation is. But if you're interested in the topic, it will be covered in the dataviz universe newsletter soon.
Fortunately, d3.js has a module called d3-delaunay that does this triangulation for us. You can import this module as follow. You can also read its complete doc on github.
import { Delaunay } from "d3";Start by creating a delaunay object thanks to the Delaunay.from() function. This function expects an array of array of numbers, so there is a tiny bit of data wrangling to do here.
const delaunay = useMemo(() => {
  const formattedData = data.map((d) => [xScale(d.x), yScale(d.y)]);
  return Delaunay.from(formattedData);
}, []);
This delaunay object contains all the information about the triangulation 🎉. It also has a method called render() that provides the svg path of all the adjacent triangles.
const delaunayPath = delaunay.render();This path is provided as a string that we can pass to a path svg element as follow:
const allDelaunayShapes = (
  <path d={delaunayPath} stroke="grey" fill="transparent" opacity={0.2} />
);
We can now render this inside an svg element to get an overview of this delaunay triangulation:
Second step: run a Delaunay triangulation on the set of two-dimensional points.
Voronoi diagram
The Delaunay triangulation above corresponds to the dual graph of the Voronoi diagram. Basically, it means that the circumcenters of the Delaunay triangles are the vertices of the Voronoi diagram.
But no worries, the delaunay object we built in the previous section has a voronoi() method. It computes the voronoi cell coordinates based on the delaunay information:
const voronoi = useMemo(() => {
  return delaunay.voronoi([0, 0, width, height]);
}, [data]);
We can plot the voronoi cells using the same kind of code as for the delaunay triangles. Resulting in our first voronoi diagram! 🎉
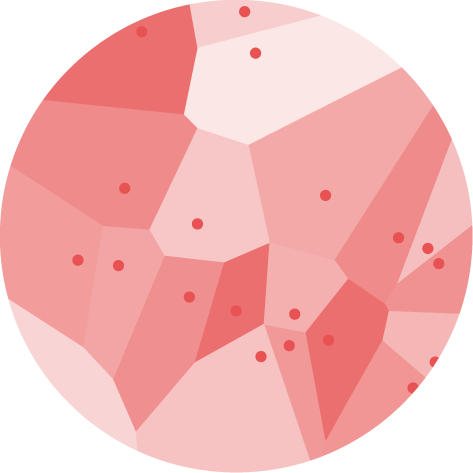
Last step: join the circumcenters of each triangle to get the voronoi diagram.
Responsive Voronoi with react
The component above is not responsive. It expects 2 props called width and height and will render a Voronoi of those dimensions.
Making the Voronoi responsive requires adding a wrapper component that gets the dimension of the parent div, and listening to a potential dimension change. This is possible thanks to a hook called useDimensions that will do the job for us.
useDimensions: a hook to make your viz responsive
export const useDimensions = (targetRef: React.RefObject<HTMLDivElement>) => {

  const getDimensions = () => {
    return {
      width: targetRef.current ? targetRef.current.offsetWidth : 0,
      height: targetRef.current ? targetRef.current.offsetHeight : 0
    };
  };

  const [dimensions, setDimensions] = useState(getDimensions);

  const handleResize = () => {
    setDimensions(getDimensions());
  };

  useEffect(() => {
    window.addEventListener("resize", handleResize);
    return () => window.removeEventListener("resize", handleResize);
  }, []);

  useLayoutEffect(() => {
    handleResize();
  }, []);

  return dimensions;
}
I'm in the process of writing a complete blog post on the topic. Subscribe to the project to know when it's ready.
Voronoi inspiration
If you're looking for inspiration to create your next Voronoi, note that dataviz-inspiration.com showcases many examples. Definitely the best place to get ... inspiration!
dataviz-inspiration.com showcases hundreds of stunning dataviz projects. Have a look to get some ideas on how to make your Voronoi looks good!
visitClosest point detection
The voronoi diagram is commonly used to detect the closest data point of the mouse position. This can be pretty useful to highlight the closest point without having to hover exactly over it.
In the example below, the closest dot will be highlighted with a red circle ⭕️ using the voronoi cells.
Use the voronoi algorithm to detect the closest point of the mouse position.
Variations
A glimpse of what it is possible to do using the voronoi diagram for data visualization.
Click on the overview below to get details and code.
Closest point detection with Voronoi
Voronoi diagram in the scatterplot bg to find the mouse closest point
ToDoAdd voronoi treemap example
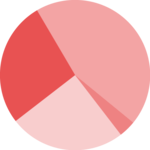
Part Of A Whole


Contact
👋 Hey, I'm Yan and I'm currently working on this project!
Feedback is welcome ❤️. You can fill an issue on Github, drop me a message on LinkedIn, or even send me an email pasting yan.holtz.data with gmail.com. You can also subscribe to the newsletter to know when I publish more content!
