Arc diagram

An arc diagram is a special kind of network graph. It is consituted by nodes that represent entities and by links that show relationships between entities. In arc diagrams, nodes are displayed along a single axis and links are represented with arcs.
This page is a step by step tutorial explaining how to build an Arc diagram component with React and D3.js. It comes with explanations and code sandboxes. It starts by simple concept like how to format the data and how to draw arcs in SVG, and then goes further with hover effect, tooltip and more.
The Data
Two layers of information are required to build an arc diagram: a list of nodes to build the circles and a list of links to build the arcs.
Many different data structures can be used to store such information. In this tutorial I suggest to start with the following:
export const data = {
  nodes: [
      { id: "Myriel", group: 'team1' },
      { id: "Anne", group: 'team1' },
      ...
  ],
  links: [
      { source: "Anne", target: "Myriel", value: 1 },
      { source: "Napoleon", target: "Myriel", value: 1 },
      ...
  ]
}
data is an object with 2 properties: nodes and links.
nodesis an array where each node is an object defined by itsidand itsgroup. Note that any other feature can be added to nodes here.linksis another array listing the connections. They are defined by asourceand atargetand optionnaly with avalue.
ToDoExplain how to build this data structure from various initial formats
Component skeleton
The goal here is to create a ArcDiagram component that will be stored in a ArcDiagram.tsx file. This component requires 3 props to render: a width, a height and some data.
The shape of the data is described above. The width and height will be used to render an svg element in the DOM, in which we will insert the arc diagram.
To put it in a nutshell, that's the skeleton of our ArcDiagram component:
import * as d3 from "d3"; // we will need d3.js

type ArcDiagramProps = {
  width: number;
  height: number;
  data: number[];
};

export const ArcDiagram = ({ width, height, data }: ArcDiagramProps) => {

  // read the data
  // compute the nodes position
  // build the arcs

  return (
    <div>
      <svg width={width} height={height}>
        // render all the arcs and circles
      </svg>
    </div>
  );
};
It's fundamental to understand that with this code organization, d3.js will be used to prepare the SVG circle, but it's React that will render them in the return() statement. We won't use d3 methods like append that you can find in usual d3.js examples.
Draw the nodes
Positionning the nodes relies on a point scale implement in the scalePoint() function of d3.
The group property of each node can be used to create an categoric color scale.
Once the scales are available, it is just a matter of looping through all nodes and render them with several circle SVG elements.
const xScale = d3.scalePoint().range([0, boundsWidth]).domain(allNodeNames);

const colorScale = d3
  .scaleOrdinal<string>()
  .domain(allNodeGroups)
  .range(COLORS);

const allNodes = data.nodes.map((node) => {
  return (
    <circle
      key={node.id}
      cx={xScale(node.id)}
      cy={boundsHeight}
      r={8}
      fill={colorScale(node.group)}
    />
  );
});
Resulting in a few dots being the basis of our ongoing arc diagram 🔥.
First step of our ongoing arc diagram: the nodes are displayed at the bottom of the figure.
Draw the connections
We now have to draw the connections between nodes using arcs. All the connections are listed in the links property of the dataset. So it is just a matter of looping through them and draw some SVG for each.
Drawing an arc in SVG can be done using a path element.
Six types of path commands exist. The one we need here is the Elliptical Arc Curve. Its syntax is a bit complicated but here is a function that will get the d attribute of the path we need from the coordinates of 2 points:
const horizontalArcGenerator = (
xStart,
yStart,
xEnd,
yEnd
) => {
return [
// the arc starts at the coordinate xStart, xEnd
"M",
xStart,
yStart,
// A means we're gonna build an Elliptical Arc Curve
"A",
(xStart - xEnd) / 2, // rx: first radii of the ellipse (inflexion point)
(xStart - xEnd) / 2, // ry: second radii of the ellipse (inflexion point)
0, // angle: rotation (in degrees) of the ellipse relative to the x-axis
1, // large-arc-flag: large arc (1) or small arc (0)
xStart < xEnd ? 1 : 0, // sweep-flag: the clockwise turning arc (1) or counterclockwise turning arc (0)
// Position of the end of the arc
xEnd,
",",
yEnd,
].join(" ");
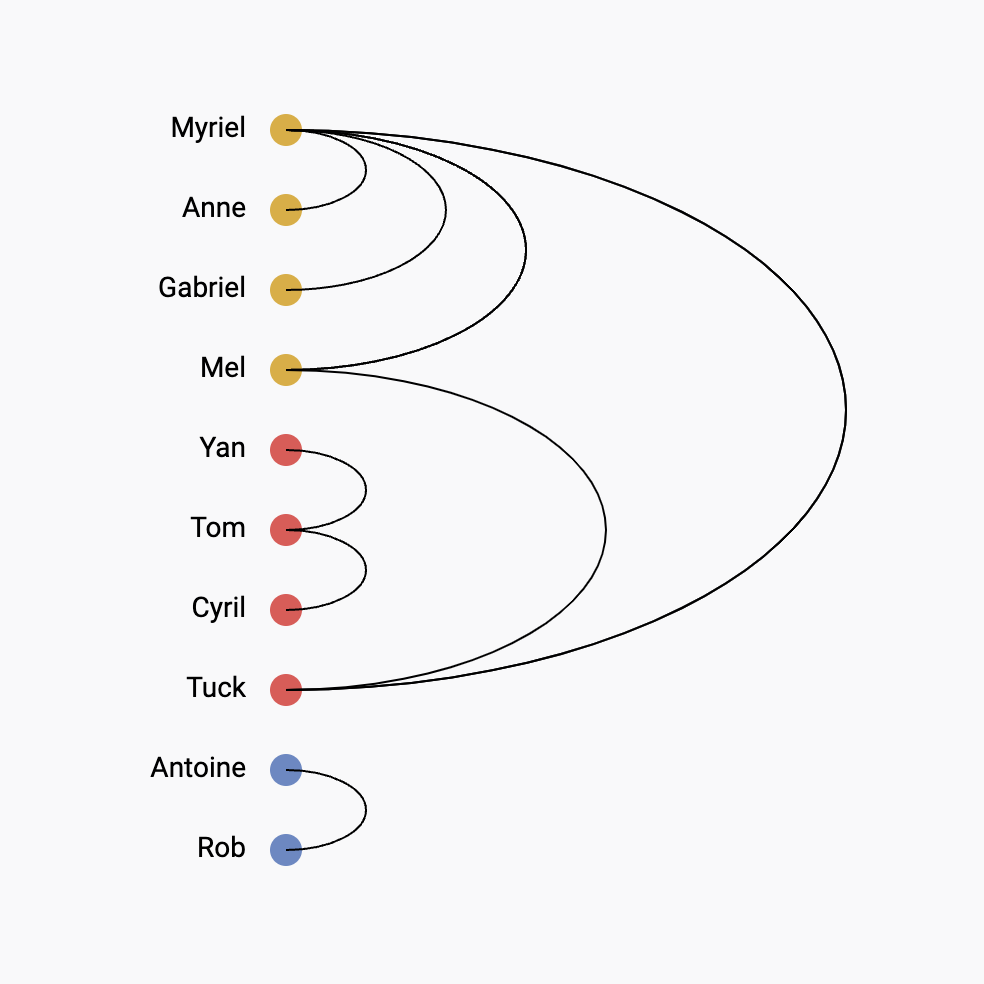
};We can call this function for each link and pass the result to a pathelement. It results in our first basic arc diagram 😋
Add arcs using a custom functionn that draws some elliptical arc curve in SVG.
Responsive Arc Diagram with react
The component above is not responsive. It expects 2 props called width and height and will render a Arc Diagram of those dimensions.
Making the Arc Diagram responsive requires adding a wrapper component that gets the dimension of the parent div, and listening to a potential dimension change. This is possible thanks to a hook called useDimensions that will do the job for us.
useDimensions: a hook to make your viz responsive
export const useDimensions = (targetRef: React.RefObject<HTMLDivElement>) => {

  const getDimensions = () => {
    return {
      width: targetRef.current ? targetRef.current.offsetWidth : 0,
      height: targetRef.current ? targetRef.current.offsetHeight : 0
    };
  };

  const [dimensions, setDimensions] = useState(getDimensions);

  const handleResize = () => {
    setDimensions(getDimensions());
  };

  useEffect(() => {
    window.addEventListener("resize", handleResize);
    return () => window.removeEventListener("resize", handleResize);
  }, []);

  useLayoutEffect(() => {
    handleResize();
  }, []);

  return dimensions;
}
I'm in the process of writing a complete blog post on the topic. Subscribe to the project to know when it's ready.
Arc Diagram inspiration
If you're looking for inspiration to create your next Arc Diagram, note that dataviz-inspiration.com showcases many examples. Definitely the best place to get ... inspiration!
dataviz-inspiration.com showcases hundreds of stunning dataviz projects. Have a look to get some ideas on how to make your Arc Diagram looks good!
visitVariations
Once you've understood how to build a basic arc diagram with d3 and react, it opens an infinite world of customization. Here are a few examples highlighting what it is possible to do with arc diagrams.
Click on the overview below to get details and code.


Contact
👋 Hey, I'm Yan and I'm currently working on this project!
Feedback is welcome ❤️. You can fill an issue on Github, drop me a message on LinkedIn, or even send me an email pasting yan.holtz.data with gmail.com. You can also subscribe to the newsletter to know when I publish more content!
