Hierarchical edge bundling
A hierarchical edge bundling chart allows to visualize relationships between entities organized in a hierarchy. The idea is to bundle the adjacency edges together to decrease the clutter usually observed in complex networks.
This page explains how to build a hierarchical edge bundling chart using d3.js to compute the node position, and React to render the nodes and edges. It starts by describing the required data format, explains how to build a very basic hierarchical edge bundling and then shows how to customize it.
The Data
The dataset describes a hierarchy using a recursive structure.
Each item in this structure is called a node. The lowest nodes of the hierarchy being called leaves.
The dataset is an object that has at least 3 properties: name, value and children. children is an array of nodes that have this structure too.
This kind of data is very close to what's required for a dendrogram. But an additional property is added for the leaves: links. It provides a list of all the other leaves this leaf is connected with.
Here is a minimal example of the data structure:
const data = {
  type: 'node',
  name: "boss",
  value: 2300,
  children: [
    {type: 'leaf', name:"Mark", value: 90, links: ['Robert', 'Emily']},
    {type: 'leaf', name:"Robert", value: 12, links: ['Emily']},
    {type: 'leaf', name:"Emily", value: 34, links: []},
    ...
}Note: if your data is not formatted this way at all, don't fret! I provide explanation on how to reach this format from other common formats here.
The hierarchy format or "root node"
A hierarchical edge bundling chart is a hierarchical layout.
D3.js has a lot of utility functions allowing to deal with this kind of hierarchical data. To use those functions we first need to create a "Root node" or "Hierarchy".
This is possible thanks to the hierarchy function of d3, and I extensively described the process in the dendrogram section of this gallery.
const hierarchy = useMemo(() => {
  return d3.hierarchy(data);
}, [data]);
Once this is done, we have a js object that will be very convenient to manipulate to create our chart.
The cluster() function
We now have a hierarchy object that is a convenient data structure. From this, we need to compute the position of each node in our 2d space.
This is made possible thanks to the cluster() function of d3.js. You can check its offical documentation.
The work done here is exactly the same as for a radial dendrogram, so I suggest to follow the dendrogram page for more in-depth explanation.
const dendrogramGenerator = d3
      .cluster<Tree>()
      .size([360, radius])

const dendrogram = dendrogramGenerator(hierarchy);
The output is almost the same as the initial hierarchy object. But for each node we have 2 additional properties: x and y that are the coordinates we need to build the dendrogram!
Radial dendrogram
Once more, it is crucial to understand that a hierarchical edge bundling starts with the layout of a radial dendrogram.
To understand how to deal with polar coordinates and how to draw clean circular labels, please visit the dendrogram and the circular barplot sections. 👇
If you are in your confort zone here, you can also just read the code directly
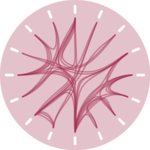
A minimalist radial dendrogram built using d3 and react.
Hierarchical edge bundling
The last but trickiest part of our graph creation is to draw the links between leaves.
→ Drawing curves with d3.curveBundle
We need a specific way to draw connections using curves. It can be done as follow. BUNDLE_COEFF is a value between 0 and 1, 0 beeing a straight line and 1 being more influenced by dots on the path.
const linksGenerator = d3
  .lineRadial()
  .radius((d) => d.y)
  .angle((d) => (d.x / 180) * Math.PI)
  .curve(d3.curveBundle.beta(BUNDLE_COEFF));
→ Find the path from leaf to leaf
We want to draw a connection between a leaf to another, passing through all the common ancestors. It is possible to find the list of nodes to traverse thanks to the path() method attached to a node!
Here is the whole pipeline with comments:
// Compute a map from name to node.
let nameToNodeMap = {};
dendrogram.descendants().map((node) => {
  nameToNodeMap[node.data.name] = node;
});

// Draw connections
const allEdges = dendrogram
  .descendants() // find all nodes of the tree
  .filter((node) => node.data.type === "leaf" && node.data.links.length > 0) // keep only leaves that have links
  .map((sourceNode, i) => {
    return sourceNode.data.links.map((targetNodeName: string) => { // Loop through all the links we need to draw
      const traversedNodes = sourceNode.path(nameToNodeMap[targetNodeName]); // The path function provides a list of all the nodes we need to traverse from source to target!

      const traversedCoords = traversedNodes.map((node) => { // Find the coordinates of all nodes on the way
        return { x: node.x, y: node.y };
      });

      return (
        <path
          key={i}
          fill="none"
          stroke="grey"
          d={linksGenerator(traversedCoords)} // transform the list of coordinates to an SVG path
        />
      );
    });
  });
Resulting in our first hierarchical edge bundling example 🎉
A first hierarchical edge bundling chart made with d3 and react.
Coming soon
Using canvas for rendering is often a requirement when the number of nodes gets big. Interactivity is often necessary, for hover effect or to collapse a part of the tree. It also possible to map the node circle size to a numeric variable.
This will come soon! I have a newsletter called the dataviz universe where I share my latest updates.


Contact
👋 Hey, I'm Yan and I'm currently working on this project!
Feedback is welcome ❤️. You can fill an issue on Github, drop me a message on LinkedIn, or even send me an email pasting yan.holtz.data with gmail.com. You can also subscribe to the newsletter to know when I publish more content!
