Interactivity
Interactivity is a key feature of any chart displayed on the web. It includes tooltip, hover effect, cross-graph interaction, zooming, panning and more.
Interactivity is a big topic. This section aims at giving general tips and tricks on the topic together with applied examples ready to be used in your project.
Work in Progress
This section is a work in progress. 🚧
For now, it just lists all the charts using Interactivity in the gallery.
But I plan to write some complete tutorials on this passionating and complicated topic. You can subscribe to the project to know when it's ready!
Scatterplot Hover effect
How to add a hover effect to highlight a group on a scatterplot
Bubble plot data set transition
How to smoothly animate the transition between dataset
Violin to Boxplot transition
Using shape morphism to smoothly transition from a boxplot to a violin and reverse
Bucket size effect
Interactive example showing the bucket size effect on a violin chart
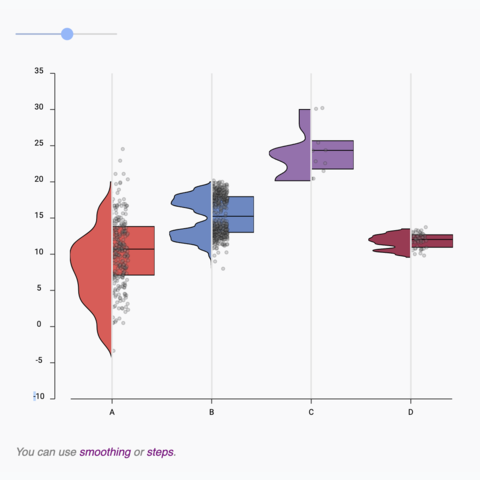
Boxplot to Violin plot
Interactive example showing the difference between a boxplot and a violin
Histogram dataset transition
How to animate the transition between datasets
Barplot dataset transition
How to smoothly animate the transition between dataset
Line chart with dataset transition
How to smoothly animate the transition between 2 dataset on a line chart
Streamgraph with hover effect
How to add a hover effect on a streamgraph to highlight a group
Offset and Smoothing transition
An interactive streamgraph example showing how to animate transition between the chart stacking features.
Streamgraph application
Streamgraph with a slider to zoom on a time stamp and with interactive inline legends
General Knowledge
Contact
👋 Hey, I'm Yan and I'm currently working on this project!
Feedback is welcome ❤️. You can fill an issue on Github, drop me a message on LinkedIn, or even send me an email pasting yan.holtz.data with gmail.com. You can also subscribe to the newsletter to know when I publish more content!
