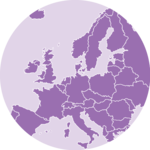
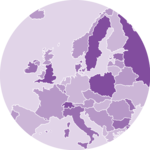
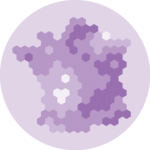
Cartogram
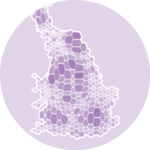
A cartogram is a map in which the geometry of regions is distorted in order to convey the information of an alternate variable.
It is possible to build a Cartogram react component thanks to a js library called topogram. This page provides step-by-step explanations on how to use the library based on a geoJson file with the help of d3.js for manipulating such a data source.
The Data
Probably uses the same as for a choropleth map or for a bubble map.
The Topogram library
As far as I can tell the best way to create a cartogram in JS is the topogram library.
However it looks like there is no easy way to install it using npm. The easiest way is probably to clone the repo and create the build, or to copy the content of the cartogram.js file.
ToDoAdd example of usage of the topogram lib


Contact
👋 Hey, I'm Yan and I'm currently working on this project!
Feedback is welcome ❤️. You can fill an issue on Github, drop me a message on Twitter, or even send me an email pasting yan.holtz.data with gmail.com. You can also subscribe to the newsletter to know when I publish more content!