Hexbin Map
A hexbin map is a visual representation of data that aggregates individual data points into hexagonal bins or cells, typically used for spatial analysis. It helps to condense large datasets and identify patterns or trends within specific geographic regions.
Two types of hexbin map exist. The first one is based on a geoJsonfile that provides the hexagon boundaries. It is similar to a choropleth map, with hexagons instead of real regions. The second is actually a 2d density chart, but with GPS locations for the x and y coordinates.
This page is a long form tutorial explaining how to build hexbin maps using react and d3.js. It provides interactive examples for both types of hexbin maps with code explanation and should get you started for your web app.
Hexbin map from a geoJson file
Drawing a map using react and d3.js usually relies on a geoJson file. This file format provides information for geographical regions. It stores the 2d coordinates of shapes.
This is the way it looks:
{
  "type": "FeatureCollection",
  "features": [
      {
        type: 'Feature',
        geometry: {
          type: 'Polygon',
          coordinates: [
            [
              [-72.625738, 55.313204], // 7 2d coordinates for the heaxagon angles
              [-69.902864, 54.408434],
              [-69.902864, 52.537442],
              [-72.625738, 51.57081],
              [-75.348611, 52.537442],
              [-75.348611, 54.408434],
              [-72.625738, 55.313204],
            ],
          ],
        },
        properties: {
          iso3166_2: 'ME',
          google_name: 'Maine',
        },
      },
      ...next hexagon
  ]
}
It is basically an object, with a features property that is of great interest. This prop is an array, each item of the array being a shape that we will be able to draw.
In the case of a hexbin map, each shape is an hexagon. But drawing it with react and d3.js follows exactly the same principle as what's done for a classic background map.
I strongly suggest to read the background map section of the gallery that provides in-depth explanations.
Map section
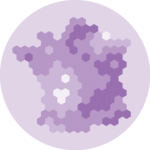
On top of that, here is an example coming with a sandbox to see it in action. Note the use of the centroid() function to find the baricenter of each US state. Very handy to position the hexagon label accurately 🔥.
First very hexbin map made with d3.js and React. Check the map section for more code explanation.
Hexbin choropleth map
The previous map looks good but does not provide a lot of value. What we usually need is to color each region (=hexagon) of the hexbin map according to a numeric value.
This results in a hexbin choropleth map.
The process is very close to what's done for a usual choropleth map. So please check the related section of the gallery that provides a lot of explanations and examples.
Choropleth section
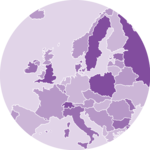
Basically, a second dataset is used to store a numeric value for each region. Here, this value provides the mariage rate per 1000 people as explained in the original R post.
Then, a color scale is created. When looping through each region of the geoJson file to draw them, the numeric value is retrieved and translated into a color thanks to the color scale.
Here is the result:
A choropleth hexbin map built with react and d3.js from a geoJson file.
Hexbin map from a set of 2d coordinates
This is another type of hexbin map. The result looks similar, but the input dataset is totally different.
Consider a dataset storing a lot of events, each having a geographical location. It is possible to split the 2d space in a bunch of hexagons and count how many events took place in each hexagon.
This is called a 2d density chart and the react graph gallery has a dedicated section on the topic.
2d density section
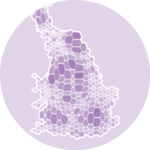
If the data point x and y values are GPS coordinates, it will look like a map! Here is an example where I retrieved the location of people tweeting about #surf in Europe for a few weeks:
A hexbin map built with react and d3.js from a set of 2d coordinates.
ToDoshould I apply a projection to the coordinates 🤔
ToDosame thing with a background map below the hexagons
Color legend
A hexbin choropleth map uses a color scale to encode a numeric value into a color. As a result, it is very much advised to add a color legend to explicit how this color scale works.
Let's consider a variable that goes from 0 to 100. We want to encode 0 in blue and 100 in purple. The color scale is built thanks to the scaleLinear() function of d3 as described above.
A color legend built with react, canvas and d3.
The trick here is to create a canvas element of the desired width and height. Then, loop from left to right and add one rectangle for each pixel with the corresponding color using the same color scale as the one used on the chart. It's important to do it in canvas: you don't want to add 300 elements in your DOM if your legend is 300px wide.
Once the canvas element is instantiated with a ref, you can draw the color scale thanks to a useEffect like this:
type BubbleLegendProps = {
  scale: d3.ScaleLinear<number, number, never>;
  tickNumber: number;
};

export const BubbleLegend = ({ scale, tickNumber }: BubbleLegendProps) => {
  const ticks = scale.ticks(tickNumber);
  const maxValue = ticks[ticks.length - 1];

  const diameter = scale(maxValue) * 2; // diameter of the biggest circle

  const dashWidth = diameter / 2 + 10;

  const allCircles = ticks.map((tick, i) => {
    const xCenter = diameter / 2;
    const yCircleTop = diameter - 2 * scale(tick);
    const yCircleCenter = diameter - scale(tick);

    return (
      <g key={i}>
        <circle
          cx={xCenter}
          cy={yCircleCenter}
          r={scale(tick)}
          fill="none"
          stroke="black"
        />
        <line
          x1={xCenter}
          x2={xCenter + dashWidth}
          y1={yCircleTop}
          y2={yCircleTop}
          stroke="black"
          strokeDasharray={"2,2"}
        />
        <text
          x={xCenter + dashWidth + 4}
          y={yCircleTop}
          fontSize={10}
          alignmentBaseline="middle"
        >
          {tick}
        </text>
      </g>
    );
  });

  return (
    <svg width={diameter} height={diameter} overflow="visible">
      {allCircles}
    </svg>
  );
};
Then you probably want to add some ticks on top of the color graduation to make it insightful.
Fortunately, the d3 linearScale comes with a handy tick() function. Basically, calling xScale.ticks(4) will create an array with approximately 4 items, each providing everything you need to draw a smartly located tick.
Color Legend is a big topic. There is much more to say about it and I'll post a complete blog post on the topic soon. Subscribe to the gallery if interested!
Responsive Hexbin with react
The component above is not responsive. It expects 2 props called width and height and will render a Hexbin of those dimensions.
Making the Hexbin responsive requires adding a wrapper component that gets the dimension of the parent div, and listening to a potential dimension change. This is possible thanks to a hook called useDimensions that will do the job for us.
useDimensions: a hook to make your viz responsive
export const useDimensions = (targetRef: React.RefObject<HTMLDivElement>) => {

  const getDimensions = () => {
    return {
      width: targetRef.current ? targetRef.current.offsetWidth : 0,
      height: targetRef.current ? targetRef.current.offsetHeight : 0
    };
  };

  const [dimensions, setDimensions] = useState(getDimensions);

  const handleResize = () => {
    setDimensions(getDimensions());
  };

  useEffect(() => {
    window.addEventListener("resize", handleResize);
    return () => window.removeEventListener("resize", handleResize);
  }, []);

  useLayoutEffect(() => {
    handleResize();
  }, []);

  return dimensions;
}
I'm in the process of writing a complete blog post on the topic. Subscribe to the project to know when it's ready.
Hexbin inspiration
If you're looking for inspiration to create your next Hexbin, note that dataviz-inspiration.com showcases many examples. Definitely the best place to get ... inspiration!
dataviz-inspiration.com showcases hundreds of stunning dataviz projects. Have a look to get some ideas on how to make your Hexbin looks good!
visit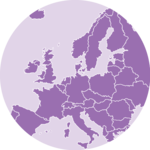


Contact
👋 Hey, I'm Yan and I'm currently working on this project!
Feedback is welcome ❤️. You can fill an issue on Github, drop me a message on Twitter, or even send me an email pasting yan.holtz.data with gmail.com. You can also subscribe to the newsletter to know when I publish more content!