Background Map
This section is dedicated to background maps. It is the fundation required to build more interesting dataviz-related mapslike bubble maps, choropleth maps and more.
The interactive sandboxes and explanation below explain how to read a geoJson file and draw its content using React. It also show how useful the d3-geo module can be to deal with this format, notably to control the various existing projections.
Last but not least, this document also briefly explains how Leaflet can be used in a React environment to display interactive maps.
The Data
The first thing you need to build a map is the 2d coordinates of the boundaries of the regions you want to represent. If you are trying to build a world map, you need to know where the country boundaries are located 🤷♀️.
Several formats exist to store such a piece of information. When working with d3.js, the expected format is geoJSON. A geoJSON file looks pretty much like this:
Here is a minimal example of the data structure:
{
  "type": "FeatureCollection",
  "features": [
    {
      "type": "Feature",
      "geometry": {
        "type": "Point",
        "coordinates": [102.0, 0.5]
      },
      "properties": {
        "prop0": "value0"
      }
    },
    {
      "type": "Feature",
      "geometry": {
        "type": "LineString",
        "coordinates": [
          [102.0, 0.0],
          [103.0, 1.0],
          [104.0, 0.0],
          [105.0, 1.0]
        ]
      },
      "properties": {
        "prop0": "value0",
        "prop1": 0.0
      }
    },
    ...
  ]
}
It is basically an object, with a features property that is of great interest. This prop is an array, each item of the array being a shape that we will be able to draw.
Each item has a geometry property that can be of type Point, LineString, Polygon and more. On top of that, the coordinates prop provides a list of the 2d coordinates to follow to draw the shape.
🧐
The first thing you need to do to build your map is to find the appropriate geoJson file on the web! Note that many other formats (likeshapeFiles) exist. You can find some converters online to get the geoJson translation.
D3-geo
A geoJson file provides coordinates on a sphere. But we want to display information on a screen which is a 2d space.
As a result we need to use a projection to transform the initial coordinates in a SVG or canvas path.
This is a very tricky job. Fortunately, d3 has everything we need in its d3-geo module 💙. You can install this module in your react project as follow:
npm install d3-geoAll the map examples of this gallery rely on this d3-geo module. I strongly encourage you to take a look at the official documentation. The examples provided here are based on it, trying to make it easier to understand.
→ Note on Typescript
If you are working in a typescript environment (you should!), you probably wonder how to type the geoJson dataset properly.
Fortunately, the DefinitelyTyped repo has everything we need as always. You can load all the types we need using:
npm install --save @types/geojsonOnce this is done, you can type the geoJson data as a FeatureCollection:
type MapProps = {
  width: number;
  height: number;
  data: FeatureCollection;
};
Component skeleton
The goal here is to create a Map component that will be stored in a Map.tsx file. This component requires 3 props to render: a width, a height, and some geoJson data.
The shape of the data is described above. The width and height will be used to render an svg element in the DOM, in which we will insert the map.
To put it in a nutshell, that's the skeleton of our Map component:
import * as d3 from "d3"; // we will need d3.js

type MapProps = {
  width: number;
  height: number;
  data: GeoJsonData;
};

export const Map = ({ width, height, data }: MapProps) => {

  // read the data
  // create a geoPath generator with the proper projection
  // build the paths

  return (
    <div>
      <svg width={width} height={height}>
        // render all the <path>s
      </svg>
    </div>
  );
};
It's fundamental to understand that with this code organization, d3.js will be used to prepare the SVG path, but it's React that will render them in the return() statement. We won't use d3 methods like append that you can find in usual d3.js examples.
First Map
Most of the magick comes from the geoPath() function of d3.
We want to draw a shape in SVG for every item of the geoJson input file. In the DOM this is done using a path element that has a d attribute.
The geoPath() function helps us doing this. geoPath() is a function that returns a function. It can be invoked this way:
const geoPathGenerator = d3.geoPath().projection(projection);Pretty short. We just invoke the function, providing it with the projection of our choice (more on this later).
geoPathGenerator is now a function that expects an item of the geoJSON dataset as input and returns a SVG path from it. It is thus possible to loop through the geoJson file and create apath element with the right d attribute for each shape:
const allSvgPaths = data.features
.map((shape) => {
return (
<path
key={shape.id}
d={geoPathGenerator(shape)}
stroke="black"
fill="#cb1dd1"
/>
);
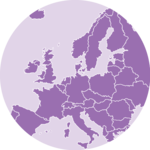
});This leads us to our first simple world map. Shapes are computed with d3. Rendering is made with react. 🎉
First very basic map made with d3.js and React.
Note: I removed Antartica and chose the most famous yet highly criticiced: Mercator.
Projections
Projections transform spherical polygonal geometry to planar polygonal geometry. D3 provides implementations of several classes of standard projections.
Setting up a projection always follow the same pattern:
const projection = d3
  .geoMercator()                              // name of the projection
  .scale(width / 2 / Math.PI)                 // scale: bigger value = more zoom
  .center([2.34, 48.86])                      // coordinate of the center of the map. e.g. 2 and 48 for Paris
  ...other options if needed
scale and center are in my opinion the 2 most useful options that you will have to setup for your projections. But once more, take a look at the doc to see every possibilities.
Now, here is a little playground to check some of the various offered projections.
An interactive playground to check how a few map projections look like on a world map.
ToDoMake a smooth transition between projections
Better performance with Canvas
canvas is recommended for dynamic or interactive data visualizations to improve performance. Indeed, drawing in SVG requires to add many elements to the DOM, which can slow down your application, especially if you try to animate transition between states.
Canvas rendering is typically faster than SVG, but requires more effort to implement styling and interaction.
Fortunatelly, the geoPath() function has everything we need to easily draw our shapes in canvas. If a context is passed to it, it understands that we are dealing with canvas and does not output SVG path like above.
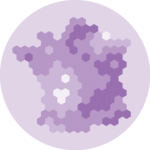
Check the example below to see how to draw with canvas:
A simple map based on a geoJson file, render using react in a canvas element.
Performance in dataviz using React is a big topic. It's impossible to go in depth here! I will publish a dedicated blog post on the topic soon, with a special focus on canvas. Please subscribe to the newsletter if you want to be notified.
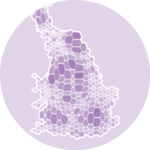
Responsive Map with react
The component above is not responsive. It expects 2 props called width and height and will render a Map of those dimensions.
Making the Map responsive requires adding a wrapper component that gets the dimension of the parent div, and listening to a potential dimension change. This is possible thanks to a hook called useDimensions that will do the job for us.
useDimensions: a hook to make your viz responsive
export const useDimensions = (targetRef: React.RefObject<HTMLDivElement>) => {

  const getDimensions = () => {
    return {
      width: targetRef.current ? targetRef.current.offsetWidth : 0,
      height: targetRef.current ? targetRef.current.offsetHeight : 0
    };
  };

  const [dimensions, setDimensions] = useState(getDimensions);

  const handleResize = () => {
    setDimensions(getDimensions());
  };

  useEffect(() => {
    window.addEventListener("resize", handleResize);
    return () => window.removeEventListener("resize", handleResize);
  }, []);

  useLayoutEffect(() => {
    handleResize();
  }, []);

  return dimensions;
}Responsiveness is a deep topic.
The responsiveness module covers it in depth: the
useDimensions hook, the wrapper pattern, and the common pitfalls to avoid.Map inspiration
If you're looking for inspiration to create your next Map, note that dataviz-inspiration.com showcases many examples. Definitely the best place to get ... inspiration!
dataviz-inspiration.com showcases hundreds of stunning dataviz projects. Have a look to get some ideas on how to make your Map looks good!
visit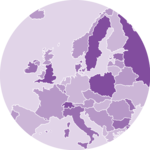


Contact
👋 Hey, I'm Yan and I'm currently working on this project!
Feedback is welcome ❤️. You can fill an issue on Github, drop me a message on LinkedIn, or even send me an email pasting yan.holtz.data with gmail.com. You can also subscribe to the newsletter to know when I publish more content!
