Connection Map

A connection map is a map where links between geographical positions are represented using lines or arcs. Most of the time, great circles are used.
This page explains how to build connection maps for the web using d3.js and react. Several tools can be used to display the background map as shown in the dedicated section. The path used to show the connection can then be computed thanks to the geoPath() function of d3.
The Data
Two pieces of information are required to build a connection map:
→ Geographic information
The first thing you need is the 2d coordinates of the boundaries of the regions you want to represent. If you are trying to build a world map, you need to know where the country boundaries are located 🤷♀️.
Several formats exist to store such a piece of information. When working with d3.js, the expected format is geoJSON. A geoJSON file looks pretty much like this:
{
  "type": "FeatureCollection",
  "features": [
    {
      "type": "Feature",
      "geometry": {
        "type": "Point",
        "coordinates": [102.0, 0.5]
      },
      "properties": {
        "prop0": "value0"
      }
    },
    {
      "type": "Feature",
      "geometry": {
        "type": "LineString",
        "coordinates": [
          [102.0, 0.0],
          [103.0, 1.0],
          [104.0, 0.0],
          [105.0, 1.0]
        ]
      },
      "properties": {
        "prop0": "value0",
        "prop1": 0.0
      }
    },
    ...
  ]
}
It is basically an object, with a features property that is of great interest. This prop is an array, each item of the array being a shape that we will be able to draw.
This format is extensively described in the background map section of the gallery. It explains how it is structured, where to find it, how to work with it and how to draw its content. Check it out!
Map section→ Link details
We need another piece of information for the links. Usually, it will be an array where each item is an object. Each object provides the coordinates of a single connection. For instance, it can have 4 properties long1, lat1, long2 and lat2 as follow:
[
  {
    long1: -58,
    long2: 2,
    lat1: -34,
    lat2: 49,
  },
  {
    long1: -58,
    long2: 145,
    lat1: -34,
    lat2: -38,
  },
  ...
}
Basic background map
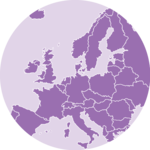
The first step is to build the background map. Basically, we need to transform the set of spherical coordinates of the geoJson file into a set of 2d coordinates and draw them.
Fortunately, the d3-geo module of d3.js has everything we need for this. It relies on the d3.geoPath() function and the whole process is extensively described in the background map section of the gallery.
First very basic map made with d3.js and React. Check the map section for more code explanation.
Note: I removed Antartica and chose the most famous yet highly criticiced: Mercator.
Drawing a single link.
The best way to represent a link between 2 geographical coordinates is to use great circles. A great circle is the circular intersection of a sphere and a plane passing through the sphere's center point. To put it more simply, a great circle is the shortest way to get from one place to another on Earth.
Drawing great circle is made possible thanks to the geoPath() function of d3.js. You can check the geoPath official documentation for a comprehensive description.
Note that geoPath() is also the function used to draw the countries on the map above! geoPath() actually knows how to deal with any GeoJSON feature or geometry object.
To draw the background map we passed a Polygon to it, i.e. an array of arrays of positions. This time we will pass a LineString, i.e. an array of positions forming a continuous line.
This is how the process looks like for a single link:
// Create a geoPath generator based on a projection.
// Same as for a background map
const projection = d3
  .geoMercator()
  .scale(width / 2 / Math.PI - 40)
  .center([10, 35]);

const geoPathGenerator = d3.geoPath().projection(projection);

// Compute the svg path of a link between Paris and NewYork
const connectionSvgPath = geoPathGenerator({
  type: 'LineString',
  coordinates: [
    [2.3522, 48.8566], // start
    [-74.006, 40.7128] // end
  ],
});

// connectionSvgPath is a string that can be used as the d argument of a <path> element
return (
  <div>
    <svg>
      <path
        d={connectionSvgPath}
        stroke="#cb1dd1"
        ...
      />
    </svg>
  </div>
);
Resulting with a first map with a single connection being drawn:
A first path drawn between Paris and New York using great circles.
Drawing several links
The exact same process can be used to draw several links on a map. Instead of calling the geoPathGenerator only once, we have to loop through a Json file to draw all the listed connections.
Here is a first connection map representing about 30 connections between some of the main cities on the planet. Click the button below to see the code.
A first connection map made with React and d3.js showing connection between cities using great circles.
Responsive Connection with react
The component above is not responsive. It expects 2 props called width and height and will render a Connection of those dimensions.
Making the Connection responsive requires adding a wrapper component that gets the dimension of the parent div, and listening to a potential dimension change. This is possible thanks to a hook called useDimensions that will do the job for us.
useDimensions: a hook to make your viz responsive
export const useDimensions = (targetRef: React.RefObject<HTMLDivElement>) => {

  const getDimensions = () => {
    return {
      width: targetRef.current ? targetRef.current.offsetWidth : 0,
      height: targetRef.current ? targetRef.current.offsetHeight : 0
    };
  };

  const [dimensions, setDimensions] = useState(getDimensions);

  const handleResize = () => {
    setDimensions(getDimensions());
  };

  useEffect(() => {
    window.addEventListener("resize", handleResize);
    return () => window.removeEventListener("resize", handleResize);
  }, []);

  useLayoutEffect(() => {
    handleResize();
  }, []);

  return dimensions;
}
I'm in the process of writing a complete blog post on the topic. Subscribe to the project to know when it's ready.
Connection inspiration
If you're looking for inspiration to create your next Connection, note that dataviz-inspiration.com showcases many examples. Definitely the best place to get ... inspiration!
dataviz-inspiration.com showcases hundreds of stunning dataviz projects. Have a look to get some ideas on how to make your Connection looks good!
visitToDodraw with Canvas
ToDoapplication to a real dataset
ToDohover effect: hover over a city to highlight its connections

Contact
👋 Hey, I'm Yan and I'm currently working on this project!
Feedback is welcome ❤️. You can fill an issue on Github, drop me a message on Twitter, or even send me an email pasting yan.holtz.data with gmail.com. You can also subscribe to the newsletter to know when I publish more content!